Page 2 of 2 FirstFirst 12
Results 31 to 53 of 53

Thread: Peter Schiff (Inflation) Debates Harry Dent (Deflation)

  1. #31
    Found a cool chart. http://visualeconomics.creditloan.co...umer-spending/


    Noting on things like transportation that in 1901 nobody owned a car and today every house seems to have multiple cars.
    Last edited by Zippyjuan; 04-01-2016 at 07:54 PM.


  2. Remove this section of ads by registering.
  3. #32
    It doesn't mattet how cool the chart is if it's that obviously misleading.
    If you only consider health insurance premiums subtracted from gross pay where employees get full coverage benefits, it might be correct. If you add in the employer contribution then it's closer to the housing figure.
    There are no crimes against people.
    There are only crimes against the state.
    And the state will never, ever choose to hold accountable its agents, because a thing can not commit a crime against itself.


  4. Remove this section of ads by registering.
  5. #33
    5 years ago I would have aggressively defended Peter's position and thought Dent a fool.

    Now it's hard to say... what every Austrian minded thinker, like Peter, continues to ignore or fail to see is that there's no other currency to park your capital into. The Yen? The Euro? The dollar is still king.

    We are deflating because the rest of the world doesn't have a good currency to run to. Everything Peter says and believes is correct but if the rest of the world keeps using your broke ass currency will it ever break? So far the answer is no and has been for almost 50 years...
    It's just an opinion... man...

  6. #34
    Quote Originally Posted by NoOneButPaul View Post
    5 years ago I would have aggressively defended Peter's position and thought Dent a fool.

    Now it's hard to say... what every Austrian minded thinker, like Peter, continues to ignore or fail to see is that there's no other currency to park your capital into. The Yen? The Euro? The dollar is still king.

    We are deflating because the rest of the world doesn't have a good currency to run to. Everything Peter says and believes is correct but if the rest of the world keeps using your broke ass currency will it ever break? So far the answer is no and has been for almost 50 years...
    $200+ Trillion in liabilities...
    Last edited by openfire; 04-02-2016 at 02:37 PM.

  7. #35
    Quote Originally Posted by Zippyjuan View Post
    As a percent of disposable income, food prices have fallen significantly over time. We used to spend about 30% of incomes on food while today it is about 11 percent- and we have a vastly larger selection of food items to choose from.

    CPI has been revised so many times to distort the true rate of the inflation of the USD as to have become a number with no relevance...

    Williams points out that one of Greenspan’s manipulations of the CPI involved the consideration that when steak got too expensive, the consumer would substitute hamburger for the steak. So, Greenspan argued, the inflation measure should reflect the costs of buying hamburger, not steak.

    “Of course, replacing hamburger for steak in the calculations would reduce the inflation rate,” Williams commented, “but it represented the rate of inflation in terms of maintaining a declining standard of living. Cost of living was being replaced by the cost of survival.”


    Read more at http://www.wnd.com/2007/11/44391/#APaagbW2r0Mt3sDE.99
    So, any charts made using the distorted number are, by default, distorted. Useless, IMHO.

  8. #36
    Quote Originally Posted by openfire View Post
    $200+ Trillion in liabilities...
    And you think Europe or Japan is better?

    Like I said... I agree with everything Peter says but the bottom line is until China or Russia or the BRICS or whomevers offer the world a more stable currency the dollar is still king. All of the unsustainable debt issues in America don't matter so long as the rest of the world's are worse.

    This is why Austrians cannot time the collapse because what they are predicting is the day the world wakes up and stops using the dollar. When is that going to happen? What is on the horizon that will displace it? These are the questions they cannot or will not answer.

    America is raising rates while the rest of the world goes negative. Capital is flying into the country and it's deflating asset prices. This will continue until they reverse on rates or on QE or both.

    In my opinion the Fed is juicing the dollar up so they can bring it back down in a time of crisis. By collapsing all the other currencies into the dollar and deflating everything they make our debt situation worse which makes them more likely to create more currency in the long run - It's like a snake eating it's own tail. I'm not saying anything about it is sound i'm simply saying that so long as the rest of the world runs to the dollar in times of uncertainty it's hard to see how this game falls apart any time soon.

    When there's another legitimate currency on the horizon threatening the dollar we can revisit this but for the time being the dollar is still the cleanest dirtiest shirt and even Peter has described it that way. In the meantime he's going to continue to pump the inflation angle because he sells gold but the reality is this - Gold, and all commodities, have collapsed over the past few years despite the Fed creating more currency than they ever had in history. There's real reasons for this and it's not some conspiracy...
    Last edited by NoOneButPaul; 04-02-2016 at 06:19 PM.
    It's just an opinion... man...

  9. #37
    Quote Originally Posted by Bossobass View Post
    CPI has been revised so many times to distort the true rate of the inflation of the USD as to have become a number with no relevance...


    So, any charts made using the distorted number are, by default, distorted. Useless, IMHO.
    CPI is updated every ten years. That is because what people can and do spend their money on changes over time. Shadow Stats uses the 1980 basket of goods - which includes things like VCRs and phonograph and cassette tape players and leaves out things like computers and cell phones and LCD TVs because they weren't invented yet.

  10. #38
    Quote Originally Posted by openfire View Post
    $200+ Trillion in liabilities...
    $200 trillion in unfunded liabilities is measured by taking what people expect to get paid out in things like Social Security for the next 70 YEARS with today's (this year's) budget revenues.

  11. #39
    Quote Originally Posted by Zippyjuan View Post
    CPI is updated every ten years. That is because what people can and do spend their money on changes over time. Shadow Stats uses the 1980 basket of goods - which includes things like VCRs and phonograph and cassette tape players and leaves out things like computers and cell phones and LCD TVs because they weren't invented yet.
    This is false. Shadowstats uses the same methodology as 1980s but does not keep a fixed basket of obsolete goods no longer in demand. It uses equivalent goods and does not use the hedonics to artificially adjust the inflation down.

    For instance, in 1980 the BLS CPI statistics included steak. The government has decided people don't eat steak as much and so has replaced it with ground beef. Those are not equivalent products. It is replacing a higher quality product with a lower quality product to artificially give the impression of less inflation. Sure people eat less steak. But that is because it has become more expensive both in absolute and relative terms. Steak has still gotten more expensive. The BLS is using the people's response to inflation to artificially pretend prices are not increasing as much as they are.

    Further, the BLS uses hedonic adjustments to also artificially misrepresent inflation. Using the television example. A high quality TV in 1980s would be a cathode ray TV. Today a high quality TV would be LED and high resolution. While the high end TV in 1980 cost $300, the high end TV today costs $1400. The difference in technology is a reflection of technological advances. Both Shadowstats and BLS use what consumer demand reflects - the new technology. High end TV 1980 vs high end TV 2016. Via Shadowstats using the BLS's prior methodology however, this would reflect a four fold increase in price over 36 years (roughly 4.4% annual inflation) . BLS however would do the same but then apply a "hedonic" adjustment. BLS methods say the new TV has increased technology and the new technology has increased value 2 fold and so the adjust the equivalent price to $700 and then say the inflation was only 2.3% annualized.

    The hedonics does measure something - it measures advances in technology, but NOT inflation. Using hedonics to artificially suppress inflation is a fraud. Certainly there are greater technologies today than in 1980. But technological advances is completely separate from the effects of the dilution of the currency. To reflect inflation you must compare equivalent consumer demand across time. So a high end luxury car in 1980 would be compared to a high end luxury car in 2016. A mid range 1980 vs. a mid range today, etc. Yes today's cars have more technology, but that does not mean cars are getting cheaper. Technology is simply advancing and consumers demand current technology.
    Last edited by AZJoe; 04-03-2016 at 09:27 AM.

  12. #40
    Shadowstats has started to update their measure to the 1990 CPI basket from the 1980 one. When they did, suddenly their rate of inflation was cut in half- dropping from around ten percent to below five percent. They recognized the old basket was too out-of-date.


    http://www.shadowstats.com/alternate...flation-charts

    And steak has not been replaced by ground beef in their basket of goods. But the substitution bias would OVERSTATE the rate of inflation by giving more weigh to the more expensive item rather than counting that a substituting consumer bought a LOWER priced item instead. Then you have a quality change bias- improvements in goods meaning getting more for your money such as fancier phones or TVs. Also not everybody buys the same things or has the same income so is is just the AVERAGE person. Costs and inflation can also vary by region or even from city to city. No, it isn't perfect but there isn't a better measure currently developed.
    Last edited by Zippyjuan; 04-03-2016 at 01:20 PM.


  13. Remove this section of ads by registering.
  14. #41
    Quote Originally Posted by fisharmor View Post
    It doesn't mattet how cool the chart is if it's that obviously misleading.
    If you only consider health insurance premiums subtracted from gross pay where employees get full coverage benefits, it might be correct. If you add in the employer contribution then it's closer to the housing figure.
    If you add the employer paid share to your income figure, it is offset.

  15. #42
    Quote Originally Posted by NoOneButPaul View Post
    And you think Europe or Japan is better?

    Like I said... I agree with everything Peter says but the bottom line is until China or Russia or the BRICS or whomevers offer the world a more stable currency the dollar is still king. All of the unsustainable debt issues in America don't matter so long as the rest of the world's are worse.

    This is why Austrians cannot time the collapse because what they are predicting is the day the world wakes up and stops using the dollar. When is that going to happen?


    It has already started...

  16. #43
    Between January 2015 and January 2016, foreign holdings of US debt have gone from $6.218 trillion to $6.183 trillion- a decline of $35 billion or 0.6%. Major sell-off? http://ticdata.treasury.gov/Publish/mfh.txt

    Yet somehow your chart claims $225 billion sold over that time- but noting that it says "central banks"- my list is "foreign holdings", include banks and other financial institutions so other foreign institutions are buying what the central banks are selling.

    http://money.cnn.com/2016/02/17/news...central-banks/

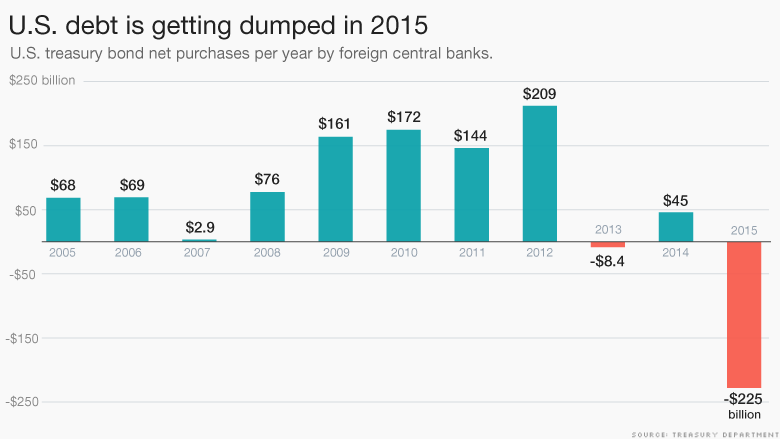
    Foreign governments sold more U.S. Treasuries than they bought in 11 out of 12 months last year, according to Treasury data.

    The U.S. debt dump is a sign of two things:
    1. How aggressive central banks are acting to keep their economy afloat amid global weakness.
    2. After years of building up savings -- the so-called "global savings glut" -- countries are starting to sell off their reserves.

    A weak currency often reflects a slowing or shrinking economy. For instance, Russia and Brazil are both in recession and their currencies have collapsed in value.

    Both these countries along with many developing countries depend on commodities like oil, metals and food, to power their growth. Commodity prices -- especially oil prices -- tanked last year and have continued to do so in 2016.

    When commodities plunge, currencies tend to follow suit. And when currencies rapidly decline, cash tends to flow out of a country and into safer havens. So central banks have tried to prevent massive capital outflows by easing their currency collapse.

    China spent $500 billion last year just to prop up its currency, the yuan. Despite all its spending, China's total holdings -- by public institutions and private investors -- of U.S. Treasury debt is up a bit from a year ago.

    That's also true for the majority of countries: total foreign holdings increased in December compared to a year ago. So even though central banks are dumping U.S. debt, there's plenty of demand for it from private investors.
    Last edited by Zippyjuan; 04-04-2016 at 01:04 PM.

  17. #44
    Quote Originally Posted by Zippyjuan View Post
    Between January 2015 and January 2016, foreign holdings of US debt have gone from $6.218 trillion to $6.183 trillion- a decline of $35 billion or 0.6%. Major sell-off? http://ticdata.treasury.gov/Publish/mfh.txt

    Yet somehow your chart claims $225 billion sold over that time- but noting that it says "central banks"- my list is "foreign holdings", include banks and other financial institutions so other foreign institutions are buying what the central banks are selling.

    http://money.cnn.com/2016/02/17/news...central-banks/
    Or maybe the Fed itself is the buyer?

  18. #45
    The Fed quite buying Treasuries in October 2014 (they do continue to roll over the ones they do have as they mature). Also they do not count as a "Foreign Holder of US Debt".

    According to their latest Balance Sheet report their holdings increased by $1.7 billion over the last year (interest from maturing bonds being the reason for that increase)- last weekend in March being the period measured.
    Last edited by Zippyjuan; 04-04-2016 at 01:21 PM.

  19. #46
    Quote Originally Posted by Zippyjuan View Post
    The Fed quite buying Treasuries in October 2014 (they do continue to roll over the ones they do have as they mature). Also they do not count as a "Foreign Holder of US Debt".
    Through foreign proxies. When China dumped US Treasuries, who soaked them up and why didn't yields rise?

  20. #47
    When did China dump Treasuries and how many did they sell?

  21. #48


  22. Remove this section of ads by registering.
  23. #49
    Belgium saw a large increase in US Treasury Holdings because of new capital requirements in Europe following the recession. Belgium is a financial center for Europe and "Foreign holdings" include all owners- including banks, financial institutions, and Central Banks. In this case, loans were required to have higher grade collateral to be approved and many started using US Treasuries for that purpose. Treasuries held in escrow for loans count as US Treasuries held in Belgium.


    A further explanation for the rise of Belgium as a big Treasury holder is financial reform that requires the greater use of top-rated government debt as collateral for derivatives trades.

    Euroclear, which holds more than €22tn in assets under custody, confirmed that the volume of US Treasuries it holds had “gone up dramatically” in recent months.

    Traders say Euroclear is renowned for its sophisticated collateral management system, which helps global investors move bonds to various clearing houses around the world.

    US Treasury paper is the largest and most liquid of “safe” collateral used to backstop the financial system. Indeed, since the financial crisis, the amount of outstanding US Treasury debt has nearly tripled to $12tn, creating a vast pool of collateral for the global financial system.
    http://www.ft.com/intl/cms/s/0/a1de1...#axzz44tBgGehh

    A quarter of a $trillion would be almost one fifth of their holdings. The article is from October, 2015. In January, 2015 China had $1.239 trillion in US treasuries. By January of 2016, that was $1.238 trillion. http://ticdata.treasury.gov/Publish/mfh.txt

    But as noted, the Foreign Holders includes central banks plus private investors and banks. The Chinese central bank did sell Treasuries but others in China were buying. That is why the China "foreign holdings" was little changed.


    Last edited by Zippyjuan; 04-04-2016 at 02:12 PM.

  24. #50
    Quote Originally Posted by Zippyjuan View Post
    Headline says they sold a quarter $trillion in Treasuries but the article says their foreign exchange holdings changed by that. ForEx holdings include many things including Treasuries and even other foreign currency holdings. I don't see any dates when this supposedly happened so I can't check the figures.

    Belgium saw a large increase in US Treasury Holdings because of new capital requirements in Europe following the recession. Belgium is a financial center for Europe and "Foreign holdings" include all owners- including banks, financial institutions, and Central Banks. In this case, loans were required to have higher grade collateral to be approved and many started using US Treasuries for that purpose.


    http://www.ft.com/intl/cms/s/0/a1de1...#axzz44tBgGehh

    A quarter of a $trillion would be almost one fourth of their holdings. That did not happen.
    You need to look at China + Belgium:

    But the real surprise emerges when stacking the monthly Chinese and Belgian holdings on top of each other. One gets the following chart, which in itself is hardly shocking...


    ... but becomes so when one also overlays China's offically reported monthly Forex reserves on top of the consolidated China+Belgium treasury holdings. Here one can easily see that indeed Belgium was nothing but an "anonymous" front for Chinese Treasury buying...


    Revealing The Identity Of The Mystery "Belgian" Buyer Of US Treasurys

  25. #51
    Harry Dent is right. Mike Maloney does a great job of covering the deflation cycle. Here are a few videos that everyone should watch.


    Sanity Check Radio Show
    http://www.SanityCheckRadioShow.com

  26. #52
    ^ The Fed will combat deflation with $ printing. That's what Dent doesn't get. He compares this situation to the deflation of the 30's, but what he ignores is that the US money supply was legally constrained by the gold standard at that time, whereas now, the Fed can - and will - print to oblivion if necessary to prevent deflation from imploding the system. QE to infinity, negative interest rates, helicopter money, or any combination thereof will be implemented, all of which are inflationary.

  27. #53
    Quote Originally Posted by openfire View Post
    ^ The Fed will combat deflation with $ printing. That's what Dent doesn't get. He compares this situation to the deflation of the 30's, but what he ignores is that the US money supply was legally constrained by the gold standard at that time, whereas now, the Fed can - and will - print to oblivion if necessary to prevent deflation from imploding the system. QE to infinity, negative interest rates, helicopter money, or any combination thereof will be implemented, all of which are inflationary.
    The reason deflation will be "allowed" is because the dollar will experience short-term strength, which will temporarily prevent the Fed from printing. The lack of access to dollars will create a credit crunch, and deflation will be well underway (people will be forced to pay down debt) when the dollar starts to loose ground to gold/silver. Then inflation will send PMs soaring. That's how I understand it.
    Sanity Check Radio Show
    http://www.SanityCheckRadioShow.com

Page 2 of 2 FirstFirst 12


Posting Permissions

  • You may not post new threads
  • You may not post replies
  • You may not post attachments
  • You may not edit your posts
  •