
Originally Posted by
Influenza

There are many factors that cause the CO2 levels to be what they are. Before the industrial revolution, the CO2 level was around 285 PPM, now it's over 400 as I said, which has not been seen in 400k years or more. The USGS estimates that volcanic activity accounts for 200 million tons of yearly CO2 emissions, while automotive and industrial activities account for over 100x that.
I don't know if there's a pretty, simplified percentage that scientists can come up with to dumb down the information for the average person to more easily digest, but they have created models about what the temperature would be with and without human influence.
 Reconstructions of global temperature that include greenhouse gas increases and other human influences (red line, based on many models) closely match measured temperatures (dashed line).[42] Those that only include natural influences (blue line, based on many models) show a slight cooling, which has not occurred.[42] The ability of models to generate reasonable histories of global temperature is verified by their response to four 20th-century volcanic eruptions: each eruption caused brief cooling that appeared in observed as well as modeled records.[42]
https://en.wikipedia.org/wiki/Attrib...climate_change
Reconstructions of global temperature that include greenhouse gas increases and other human influences (red line, based on many models) closely match measured temperatures (dashed line).[42] Those that only include natural influences (blue line, based on many models) show a slight cooling, which has not occurred.[42] The ability of models to generate reasonable histories of global temperature is verified by their response to four 20th-century volcanic eruptions: each eruption caused brief cooling that appeared in observed as well as modeled records.[42]
https://en.wikipedia.org/wiki/Attrib...climate_change
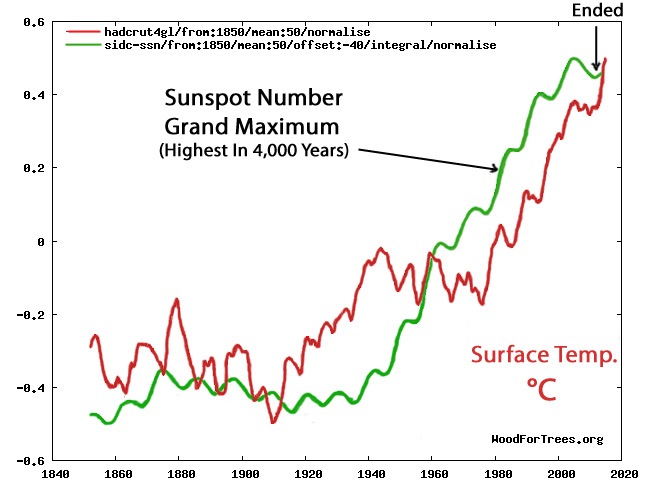
As for people talking about solar cycles... lol

In case you haven’t heard (and you probably haven’t due to the media blackout on the subject), the largest two-year global average temperature drop in a century occurred between February 2016 and February 2018. Global average temperature dropped .056C over that period according to the GISS Surface Analysis (GISSTEMP) team at NASA’s Goddard Institute for Space Studies. To find a two-year period even close to that drop, you have to back to the 1982-1984 time period when a .047C drop occurred.
GISSTEMP is pretty much the gold standard when it comes to reporting global average temperature. The UN’s Intergovernmental Panel on Climate Change (IPCC) uses GISSTEMP data in their reports. Included in the data is the biggest five-month average global temperature drop ever recorded between February to June in 2016. The fourth largest five-month drop occurred from February to June of 2017.
But how can that be with all of these “warmest year ever” reports?
The reason, of course, is that pretty much all mainstream coverage on climate change is agenda — not fact — driven. This is why there is wall-to-wall coverage of the off-the-cuff and, admittedly, rather silly statement of Mo Brooks (R-Alabama) about falling rocks causing sea level rise during a congressional hearing and nary a peep regarding the NASA data from 2016-2018. Because if, in fact, global temperature has dropped for any significant amount of time, it gives “deniers” a leg to stand on in the climate-change debate, which — despite carbon-credit salesman Al Gore’s pronouncements on the subject — is still very much ongoing.
In the weeks since Aaron Brown first reported this “Big Chill” in Real Clear Markets, the mainstream media has seen fit to push other climate-related stories. They saw a group looking to carve President Trump’s face into a glacier in order to prove global warming is real as newsworthy. The New York Times claimed that global warming is causing mischievous, insomniac bears. So much nonsense is seen as newsworthy, only because it fits the climate-alarmist narrative, while real climate data is ignored.
More at: https://www.thenewamerican.com/tech/...l-cooling-data
Water Vapor is 97% of Greenhouse Gases on Earth; Man's CO2 is 1% !!!
In The Hinge of Fate, volume 3 of his marvelous 6-volume history of World War II, Churchill reflected, “It may almost be said, ‘Before Alamein we never had a victory. After Alamein we never had a defeat.’”
The publication of Nicholas Lewis and Judith Curry’s newest paper in The Journal of Climate reminds me of that. The two authors for years have focused much of their work on figuring out how much warming should come from adding carbon dioxide to the atmosphere. In this paper they conclude that it’s at least 30 percent and probably 50 percent less than climate alarmists have claimed for the last forty years.
In fact, there are reasons to think the alarmists’ error is even greater than 50 percent. And if that is true, then all the reasons for drastic policies to cut carbon dioxide emissions – by replacing coal, oil and natural gas with wind and solar as dominant energy sources – simply disappear. Here’s another important point.
For the last 15 years or more, at least until a year or two ago, it would have been inconceivable that The Journal of Climate would publish their article. That this staunch defender of climate alarmist “consensus science” does so now could mean the alarmist dam has cracked, the water’s pouring through, and the crack will spread until the whole dam collapses.
Is this the beginning of the end of climate alarmists’ hold on climate science and policy, or the end of the beginning? Is it the Second Battle of El Alamein, or is it D-Day? I don’t know, but it is certainly significant. It may well be that henceforth the voices of reason and moderation will never suffer a defeat.
Shattered Consensus: The True State of Global Warming was edited 13 years ago by climatologist Patrick J. Michaels, then Research Professor of Environmental Sciences at the University of Virginia and the State Climatologist of Virginia; now Senior Fellow in Environmental Studies at the Cato Institute. Its title was at best premature.
The greatly exaggerated “consensus” – that unchecked human emissions of carbon dioxide and other “greenhouse” gases would cause potentially catastrophic global warming – wasn’t shattered then, and it hasn’t shattered since then. At least, that’s the case if the word “shattered” means what happens when you drop a piece of fine crystal on a granite counter top: instantaneous disintegration into tiny shards.
However, although premature and perhaps a bit hyperbolic, the title might have been prophetic.
From 1979 (when the National Academy of Sciences published “Carbon Dioxide and Climate: A Scientific Assessment”) until 2013 (when the Intergovernmental Panel on Climate Change published its “5th Assessment Report” or AR5), “establishment” climate-change scientists claimed that – if the concentration of carbon dioxide (or its equivalent in other “greenhouse” gases) doubled – global average surface temperature would rise by 1.5–4.5 degrees C, with a “best estimate” of about 3 degrees. (That’s 2.7–8.1 degrees F, with a “best” of 5.4 degrees F.)
But late in the first decade of this century, spurred partly by the atmosphere’s failure to warm as rapidly as the “consensus” predicted, various studies began challenging that conclusion, saying “equilibrium climate sensitivity” (ECS) was lower than claimed. As the Cornwall Alliance reported four years ago: “The IPCC estimates climate sensitivity at 1.5C to 4.5C, but that estimate is based on computer climate models that failed to predict the
absence of warming since 1995 and predicted, on average, four times as much warming as actually occurred from 1979 to the present. It is therefore not credible. Newer, observationally based estimates have ranges like 0.3C to 1.0C (NIPCC 2013a, p. 7) or 1.25C to 3.0C – with a best estimate of 1.75C (Lewis and Crok 2013, p. 9). Further, “No empirical evidence exists to support the assertion that a planetary warming of 2°C would be net ecologically or economically damaging” (NIPCC 2013a, p. 10).” [
Abbreviated references are identified here.]
Now, though, a journal dead center in the “consensus” – the American Meteorological Society’s Journal of Climate – has accepted a new paper, “The impact of recent forcing and ocean heat uptake data on estimates of climate sensitivity,” by Nicholas Lewis and Judith Curry. It concludes that ECS is very likely just 50–70 percent as high as the “consensus” range. (Lewis is an independent climate science researcher in the UK. Curry was Professor and Chair of the School of Earth and Atmospheric Sciences at the Georgia Institute of Technology and now is President of the Climate Forecast Applications Network.)
Here’s how Lewis and Curry summarize their findings in their abstract, with the takeaways emphasized: “Energy budget estimates of equilibrium climate sensitivity (ECS) and transient climate response (TCR) [increase in global average surface temperature at time of doubling of atmospheric CO2 concentration, i.e., 70 years assuming 1% per annum increase in concentration] are derived based on the best estimates and uncertainty ranges for forcing provided in the IPCC Fifth Assessment Scientific Report (AR5).
“Recent revisions to greenhouse gas forcing and post-1990 ozone and aerosol forcing estimates are incorporated and the forcing data extended from 2011 to 2016. Reflecting recent evidence against strong aerosol forcing, its AR5 uncertainty lower bound is increased slightly. Using a 1869–1882 base period and a 2007−2016 final period, which are well-matched for volcanic activity and influence from internal variability, medians are derived for ECS of 1.50 K (5−95%: 1.05−2.45 K) and for TCR of 1.20 K (5−95%: 0.9−1.7 K). These estimates both have much lower upper bounds than those from a predecessor study using AR5 data ending in 2011.
“Using infilled, globally-complete temperature data gives slightly higher estimates; a median of 1.66 K for ECS (5−95%: 1.15−2.7 K) and 1.33 K for TCR (5−95%:1.0−1.90 K). These ECS estimates reflect climate feedbacks over the historical period, assumed time-invariant.
“Allowing for possible time-varying climate feedbacks increases the median ECS estimate to 1.76 K (5−95%: 1.2−3.1 K), using infilled temperature data. Possible biases from non-unit forcing efficacy, temperature estimation issues and variability in sea-surface temperature change patterns are examined and found to be minor when using globally-complete temperature data. These results imply that high ECS and TCR values derived from a majority of CMIP5 climate models are inconsistent with observed warming during the historical period.”
A press release from the Global Warming Policy Forum quoted Lewis as saying, “Our results imply that, for any future emissions scenario, future warming is likely to be substantially lower than the central computer model-simulated level projected by the IPCC, and highly unlikely to exceed that level.”
Veteran environmental science writer Ronald Bailey commented on the new paper in Reason, saying: “How much lower? Their median ECS estimate of 1.66°C (5–95% uncertainty range: 1.15–2.7°C) is derived using globally complete temperature data. The comparable estimate for 31 current generation computer climate simulation models cited by the IPCC is 3.1°C. In other words, the models are running almost two times hotter than the analysis of historical data suggests that future temperatures will be.
“In addition, the high-end estimate of Lewis and Curry’s uncertainty range is 1.8°C below the IPCC’s high-end estimate.” [emphasis added]
Cornwall Alliance Senior Fellow Dr. Roy W. Spencer (Principal Research Scientist in Climatology at the University of Alabama-Huntsville and U.S. Science Team Leader for NASA’s satellite global temperature monitoring program) commented on the paper. Even Lewis and Curry’s figures make several assumptions that are at best unknown and quite likely false. He noted: “I’d like to additionally emphasize overlooked (and possibly unquantifiable) uncertainties: (1) the assumption in studies like this that the climate system was in energy balance in the late 1800s in terms of deep ocean temperatures; and (2) that we know the change in radiative forcing that has occurred since the late 1800s, which would mean we would have to know the extent to which the system was in energy balance back then.
“We have no good reason to assume the climate system is ever in energy balance, although it is constantly readjusting to seek that balance. For example, the historical temperature (and proxy) record suggests the climate system was still emerging from the Little Ice Age in the late 1800s. The oceans are a nonlinear dynamical system, capable of their own unforced chaotic changes on century to millennial time scales, that can in turn alter atmospheric circulation patterns, thus clouds, thus the global energy balance. For some reason, modelers sweep this possibility under the rug (partly because they don’t know how to model unknowns).
“But just because we don’t know the extent to which this has occurred in the past doesn’t mean we can go ahead and assume it never occurs.
“Or at least if modelers assume it doesn’t occur, they should state that up front.
“If indeed some of the warming since the late 1800s was natural, the ECS would be even lower.”
With regard to that last sentence, Spencer’s University of Alabama research colleague Dr. John Christy and co-authors Dr. Joseph D’Aleo and Dr. James Wallace published a paper in the fall of 2016 (revised in the spring of 2017). It argued that solar, volcanic and ocean current variations are sufficient to explain all the global warming over the period of allegedly anthropogenic warming, leaving no global warming to blame on carbon dioxide.
More at: https://www.cnsnews.com/commentary/e...t-be-shattered
Scientists just discovered a massive, heretofore unknown, source of nitrogen. Why does this matter? Because it could dramatically change those dire global warming forecasts that everybody claims are based on "settled science."
The researchers, whose findings were published in the prestigious journal Science, say they've determined that the idea that the only source of nitrogen for plant life came from the air is wrong. There are vast storehouses in the planet's bedrock that plants also feed on.
This is potentially huge news, since what it means is that there is a vastly larger supply of nitrogen than previously believed.
University of California at Davis environmental scientist and co-author of the study, Ben Houlton, says that "This runs counter the centuries-long paradigm that has laid the foundation for the environmental sciences."
Pay close attention to the word "paradigm."
If Houlton's finding about these vast, previously unknown nitrogen stores holds true, then it would have an enormous impact on global warming predictions.
Climate scientists have long known that plants offset some of the effects of climate change by absorbing and storing CO2. But climate scientists assumed that the ability to plants to perform this function was limited because the availability of nitrogen in the atmosphere was limited.
As a 2003 study published in the same Science journal put it, "there will not be enough nitrogen available to sustain the high carbon uptake scenarios."
In the wake of the latest findings, Ronald Amundson, a soil biogeochemist at the University of California at Berkeley, told Chemical and Engineering News that "If there is more nitrogen there than expected, then the constraints on plant growth in a high-CO2 world may not be as great as we think."
In other words, with more nitrogen available, plant life might be able to absorb more CO2 than climate scientists have been estimating, which means the planet won't warm as much, despite mankind's pumping CO2 into the atmosphere.
More at: https://www.investors.com/politics/e...itrogen-rocks/
The raw (unadjusted) data from three Indian Ocean gauges – Aden, Karachi and Mumbai – showed that local sea level trends in the last 140 years had been very gently rising, neutral or negative (ie sea levels had fallen).
But after the evidence had been adjusted by tidal records gatekeepers at the global databank Permanent Service for Mean Sea Level (PSMSL) it suddenly showed a sharp and dramatic rise.
The whistle was blown by two Australian scientists Dr. Albert Parker and Dr. Clifford Ollier in a paper for Earth Systems and Environment.
The paper – Is the Sea Level Stable at Aden, Yemen? – examines the discrepancies between raw and adjusted sea level data in Aden, Karachi and Mumbai.
More at: http://www.breitbart.com/big-governm...ea-level-rise/
Earlier we reported on ocean temperatures dropping, now we have confirmation that global air temperature is dropping as well. The latest data is in, and now according to HadCRUT data, we are back to the same level as before the 2014/2016 super El Niño event heated up the planet.
More at: https://wattsupwiththat.com/2017/11/...inues-to-cool/
In a development that could further advantage OPEC members as they step up production to compensate for falling exports out of Venezuela and (potentially) Iran, the Barents Observer is reporting that two of Russia's largest Arctic out-shipment points for oil and LNG have become "packed with ice" leaving tankers and carriers stranded in the "paralyzed" area, which hasn't been this packed with ice at midsummer in four years. Experts had expected that ice clogging up the Gulf of Ob would melt with the summer months, allowing Rosatomflots, the state-owned energy company responsible for the region, to avoid relying on their nuclear-powered icebreakers to clear the area.
Click here to view the original image of 822x328px.

According to Rosatomflot, its icebreakers will be working at least through the first week of July to free stranded ships from the ice. Two icebreakers, the Taymyr and the Vaygach, are working overtime. There are also several smaller tugs and icebreakers working in the waters around the Sabetta port.
One Rosatomflot representative pointed out that the climate change fears which had analysts worried about rapid melting of ice caps in the Arctic have apparently receded. The global warming, which there has been so much talk about for such a long time, seems to have receded a little and we are returning to the standards of the 1980s and 1990s, says company representative Andrey Smirnov.
Click here to view the original image of 890x411px.

Companies shipping from the area have in recent years invested in building more powerful tankers capable of breaking up the ice on their own. The projects are expected to ratchet up exports from the region by the equivalent of millions of barrels of oil per year. The Yamal LNG plant is fully dependent on smooth shipping to and from the port of Sabetta. A fleet of 15 powerful top ice-class carriers are being built for the project. The ships are capable of independently breaking through more than two meter thick ice. Commercial shipments from Sabetta started in early December 2017.
Further south, company Gazprom Neft is operating the Novy Port project, which is built to be able to deliver up to eight million tons of oil per year. A fleet of six tankers are being built for the Novy Port. The first vessels of the new fleet, the Shturman Albanov and the "Shturman Malygin" were put on the water in early 2016. The third fleet tanker, the “Shturman Ovtsyn” set course for the history books when it in mid-winter 2017 left the yard of the Samsung Heavy Industries in South Korea, made it through the Bering Strait and sailed all the way to Yamal. Later, also the Shturman Shcherbinin and the Shturman Koshelev webre built.
To help put the ice-pack in perspective, the blog Climateer Investor published a pair of heat-coded images showing the extent of the sea ice thickness in June 2018...

...Compared with June 2008 - a decade earlier.

So much for "global warming"...
https://www.zerohedge.com/news/2018-...ankers-trapped


 Reply With Quote
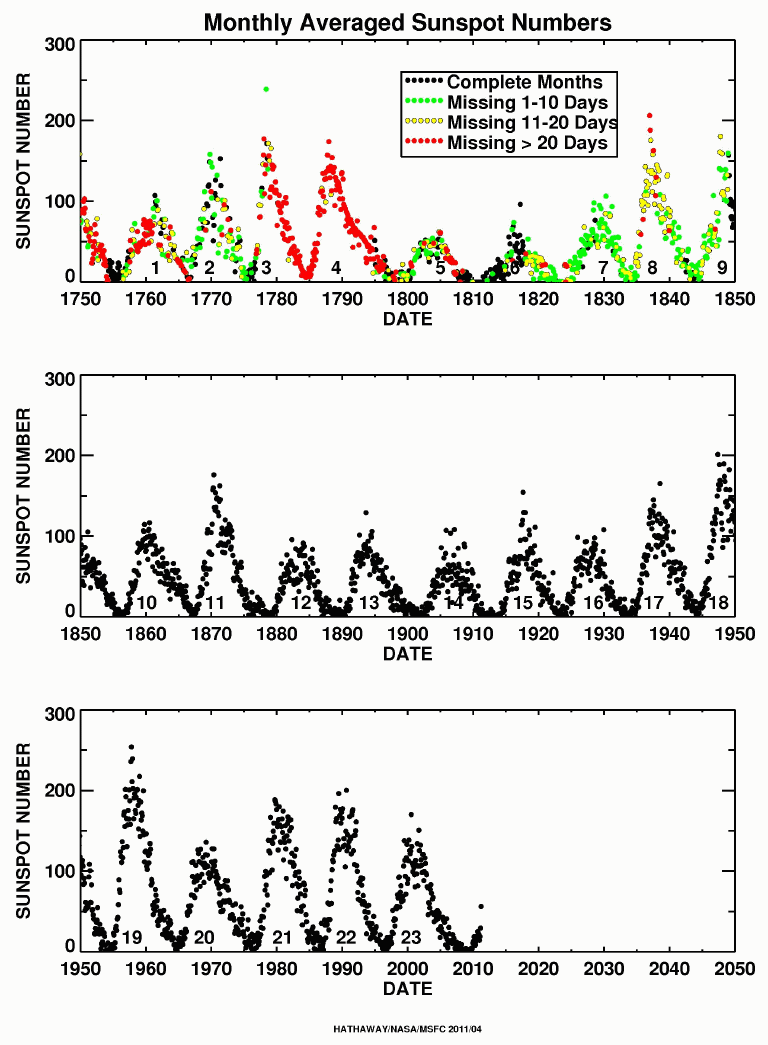


Connect With Us