Results 1 to 6 of 6

Thread: Economic Freedom of North America 2017 - NH #1 For 3rd Year in a Row

  1. #1

    Economic Freedom of North America 2017 - NH #1 For 3rd Year in a Row

    The 2017 Economic Freedom of North America Report is out. For the 3rd year in a row New Hampshire is listed as the freest state in the United States. Alberta was listed as the freest place in North America in the previous 5 reports. However this year, New Hampshire and Alberta are tied for the freest place in North America. The new placements are due to a combination of NH gaining additional economic freedom and Alberta electing a new anti-freedom government.

    Economic Freedom of North America 2017*finds that New Hampshire—the Live Free or Die state—has the highest level of economic freedom among all U.S. states for the third year in a row, scoring 8.3 out of 10 in this year’s report, which measures government spending, taxation and labour market restrictions. Florida, Texas, South Dakota and Tennessee round out the top five freest states. For the third year in a row New York was the least-free state in the country at 50th, and California ranked 49th.
    https://www.fraserinstitute.org/stud...h-america-2017

    Lifetime member of more than 1 national gun organization and the New Hampshire Liberty Alliance. Part of Young Americans for Liberty and Campaign for Liberty. Free State Project participant and multi-year Free Talk Live AMPlifier.


  2. Remove this section of ads by registering.
  3. #2
    The subnational indices
    For the purpose of comparing jurisdictions within the same country, the subnational indices are the appropriate choice. There is a separate subnational index for each country.

    In Canada, the most economically free province in 2015 was Alberta with 7.8, followed by British Columbia with 6.6 and Ontario at 6.2. However, the gap between Alberta and British Columbia is shrinking. The least free by far was Quebec at 4.2, followed by Nova Scotia at 5.0 and New Bruns-wick at 5.2.

    In Mexico, the most economically free state was Baja California at 8.0. Jalisco was second at 7.7, followed by Coahuila at 7.5. The least free Mexican states were Campeche and Chiapas at 4.9; slightly better were Guerrero at 5.0 and Oaxaca at 5.1.
    Lifetime member of more than 1 national gun organization and the New Hampshire Liberty Alliance. Part of Young Americans for Liberty and Campaign for Liberty. Free State Project participant and multi-year Free Talk Live AMPlifier.

  4. #3
    HI might not be the freest place in the nation, but the weather is pretty good this time of year

    Hawaii among worst states for economic freedom, study says
    By*Anna Hrushka*
    Reporter, Pacific Business News
    https://www.bizjournals.com/pacific/...c-freedom.html

    While Hawaii has seen a slight improvement, the state is still among one of the worst when it comes to economic freedom, according to a new report by the Grassroot Institute of Hawaii.

    The *Economic Freedom of North America*report, which was released in conjunction with Canada’s Fraser Institute, placed Hawaii 45th out of the 50 states, up from 46th the year before.

    Kelii*Akina, president of the Grassroot Institute of Hawaii cited “onerous taxation and regulation” as the primary drivers behind the state’s low ranking.

    The report measures government spending, taxation and labor market restrictions, using data from 2015, the most recent year of available comparable data.

    “The Economic Freedom index is a good way to measure government interference in the free market,”*Akina*said in a statement. “Unfortunately, in Hawaii, we find that red tape and excessive taxes have throttled our economic freedom, thus raising the cost of doing business, limiting economic growth in the state.”

    According to the report, Hawaii scored worst for its top marginal income tax rate, its income tax and payroll tax revenues as a percentage of income.

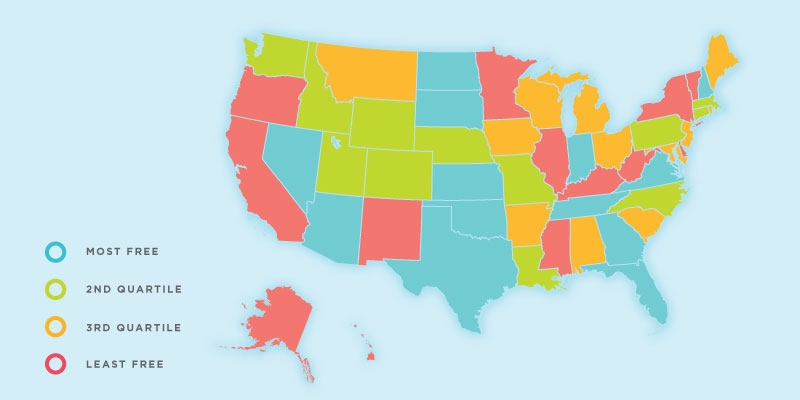
    For the third year in a row, New Hampshire had the highest level of economic freedom among all U.S. states.
    Lifetime member of more than 1 national gun organization and the New Hampshire Liberty Alliance. Part of Young Americans for Liberty and Campaign for Liberty. Free State Project participant and multi-year Free Talk Live AMPlifier.

  5. #4
    This does not look accurate . Tn at 5 with a 10 percent sales tax seems a bit off .

  6. #5
    Quote Originally Posted by oyarde View Post
    This does not look accurate . Tn at 5 with a 10 percent sales tax seems a bit off .
    It looks at less factors than the most respected report, the Freedom in the 50 States report. Here are quotes from the report.

    The formatting is better at the link posted. I recommending viewing there.

    Description of components
    The theory of economic freedom is no different at the subnational level than it is at
    the global level, although different variables consistent with the theory of economic
    freedom must be found that suit subnational measures. The 10 components of the sub-
    national index fall into three areas: Government Spending, Taxes, and Labor Market
    Freedom. Most of the components we use are calculated as a ratio of income in each
    jurisdiction and thus do not require the use of exchange rates or purchasing power
    parities (PPP). The exception is component 2B, Top Marginal Income Tax Rate and
    the Income Threshold at Which It Applies, where purchasing power parity is used to
    calculate equivalent top thresholds in Canada and Mexico in US dollars.
    Using a simple mathematical formula to reduce subjective judgments, a scale
    from zero to 10 for each component was constructed to represent the underlying
    distribution of each of the 10 components in the index. The highest possible score
    on each component is 10, which indicates a high degree of economic freedom and
    the lowest possible score is 0, which indicates a low degree of economic freedom.6
    Thus, this index is a relative ranking. The rating formula is consistent across time to
    allow an examination of the evolution of economic freedom. To construct the overall
    index without imposing subjective judgments about the relative importance of the
    components, each area was equally weighted and each component within each area
    was equally weighted (see Appendix A: Methodology, p. 52, for more details).
    In order to produce comparable tax and spending data for jurisdictions that
    are of widely different sizes and income levels, all such variables are standardized by
    dividing by income (as is the minimum-wage variable). In Canada and Mexico, we use
    “household income”; in the United States, the comparable concept is called “personal
    income”. We use income instead of GDP because there are some jurisdictions where
    there are large levels of economic activity (included in GDP) that do not directly
    benefit residents and GDP thus overstates the resources that residents have available
    to pay the burden of government. For example, due to peculiarities in its tax law, the
    US state of Delaware has an abnormally high number of corporate bank headquarters.
    Much of the revenue generated by those operations goes to shareholders outside of
    Delaware. Those dollars are included in GDP, making taxes and spending seem less
    burdensome as a percentage of the economy than they actually are. Those dollars are
    not included in personal income, so using income provides a more accurate measure
    of the level of economic freedom.
    Last edited by Keith and stuff; 12-27-2017 at 12:40 PM.
    Lifetime member of more than 1 national gun organization and the New Hampshire Liberty Alliance. Part of Young Americans for Liberty and Campaign for Liberty. Free State Project participant and multi-year Free Talk Live AMPlifier.

  7. #6
    Area 1 Government Spending
    1A General Consumption Expenditures by Government as a Percentage of Income
    As the size of government expands, less room is available for private choice. While gov-
    ernment can fulfill useful roles in society, there is a tendency for government to under-
    take superfluous activities as it expands: “there are two broad functions of government
    that are consistent with economic freedom: (1) protection of individuals against inva-
    sions by intruders, both domestic and foreign, and (2) provision of a few selected goods—
    what economists call public goods” (Gwartney, Lawson, and Block, 1996:*22). These
    two broad functions of government are often called the “protective” and “productive”
    functions of government. Once government moves beyond these two functions into the
    provision of private goods, goods that can be produced by private firms and individu-
    als, it restricts consumer choice and, thus, economic freedom (Gwartney, Lawson, and
    Block, 1996). In other words, government spending, independent of taxation, by itself
    reduces economic freedom once this spending exceeds what is necessary to provide a
    minimal level of protective and productive functions. Thus, as the size of government
    consumption expenditure grows, a jurisdiction receives a lower score in this component.
    1B Transfers and Subsidies as a Percentage of Income
    When the government taxes one person in order to give money to another, it sepa-
    rates individuals from the full benefits of their labor and reduces the real returns of such
    activity (Gwartney, Lawson, and Block, 1996). These transfers represent the removal of
    property without providing a compensating benefit and are, thus, an infringement on
    economic freedom. Put another way, when governments take from one group in order to
    give to another, they are violating the same property rights they are supposed to protect.
    The greater the level of transfers and subsidies, the lower the score a jurisdiction receives.
    1C Insurance and Retirement Payments as a Percentage of Income
    When private, voluntary arrangements for retirement, disability insurance, and so on
    are replaced by mandatory government programs, economic freedom is diminished.
    As the amount of such spending increases, the score on this component declines.
    1D Government enterprises and investment (all-government index only)
    When government owns what would otherwise be private enterprises and engages in
    more of what would otherwise be private investment, economic freedom is reduced.
    This variable, used only in the all-government index, is the country score for variable
    1C in Economic Freedom of the World: 2017 Annual Report. A detailed description and
    data sources can be found in that report, available at <https://www.fraserinstitute.org/
    studies/economic-freedom-of-the-world-2017-annual-report>.
    Area 2 Taxes
    As the tax burden grows, the restrictions on private choice increase and thus eco-
    nomic freedom declines. We examine the major forms of taxation separately.


    2A Income and Payroll Tax Revenue as a Percentage of Income
    This variable includes all personal and corporate income taxes as well as payroll taxes
    used to fund social insurance schemes (i.e., employment insurance, Workers Com-
    pensation, and various pension plans).
    2Bi Top Marginal Income Tax Rate7 and the Income Threshold at Which It Applies
    Because marginal income tax rates represent the direct penalty on economic activity,
    in addition to the revenue variable, we include a variable that incorporates the top tax
    rate as well as the income level at which that rate applies. Top personal income-tax
    rates are rated by the income thresholds at which they apply. Higher thresholds result
    in a better score. More details can be found in Appendices A and B.
    2Bii Top marginal income and payroll tax rate (all-government index only)
    This variable, used only in the all-government index, is the country score for variable
    1Dii in Economic Freedom of the World: 2017 Annual Report. A detailed description
    and data sources can be found in that report, available at <https://www.fraserinstitute.
    org/studies/economic-freedom-of-the-world-2017-annual-report>.
    2C Property Tax and Other Taxes as a Percentage of Income
    This variable includes all forms of taxation other than income, payroll, and sales taxes
    (which are already captured in variables 2A and 2D), with one exception. Revenue
    from taxes on natural resources are excluded for three reasons: 1. most areas do not
    have them; 2. their burden is largely exported to taxpayers in other areas; 3. they can
    fluctuate widely along with the prices of natural resources (for example, oil), thereby
    creating outliers that distort the relative rankings.
    2D Sales Tax Revenue as a Percentage of Income
    This variable includes all sales and gross receipts taxes (including excise taxes). Such
    taxes are a major source of revenue for subnational governments.
    Note about intergovernmental transfers and double counting
    In examining the two areas above, it may seem that Areas 1 and 2 create a double
    counting, in that they capture the two sides of the government ledger sheet, revenues
    and expenditures, which presumably should balance over time. However, in exam-
    ining subnational jurisdictions, this situation does not hold. A number of intergov-
    ernmental transfers break the link between taxation and spending at the subnational
    level.8 The break between revenues and spending is even more pronounced at the

    all-government level, which includes the federal government. Obviously, what the
    federal government spends in a state or a province does not necessarily bear a strong
    relationship to the amount of money it raises in that jurisdiction. Thus, to take exam-
    ples from both Canada and the United States, the respective federal governments
    spend more in the province of Newfoundland & Labrador and the state of West
    Virginia than they raise through taxation in these jurisdictions while the opposite
    pattern holds for Alberta and Connecticut. As discussed above, both taxation and
    spending can suppress economic freedom. Since the link between the two is broken
    when examining subnational jurisdictions, it is necessary to examine both sides of
    the government’s balance sheet.
    Area 3 Regulation
    3A Labor Market Freedom
    3Ai Minimum Wage Legislation
    High minimum wages restrict the ability of employees and employers to negotiate
    contracts to their liking. In particular, minimum wage legislation restricts the ability
    of low-skilled workers and new entrants to the workforce to negotiate for employ-
    ment they might otherwise accept and, thus, restricts the economic freedom of these
    workers and the employers who might have hired them.
    This component measures the annual income earned by someone working full
    time at the minimum wage as a percentage of per-capita income. Since per-capita income
    is a proxy for the average productivity in a jurisdiction, this ratio takes into account dif-
    ferences in the ability to pay wages across jurisdictions. As the minimum wage grows
    relative to productivity, thus narrowing the range of employment contracts that can be
    freely negotiated, there are further reductions in economic freedom, resulting in a lower
    score for the jurisdiction. For example, minimum wage legislation set at 0.1% of average
    productivity is likely to have little impact on economic freedom; set at 50% of average
    productivity, the legislation would limit the freedom of workers and firms to negotiate
    employment to a much greater extent. For instance, a minimum wage requirement of $2
    an hour for New York will have little impact but, for a developing nation, it might remove
    most potential workers from the effective workforce. The same idea holds, though in a
    narrower range, for jurisdictions within Canada and the United States.
    3Aii Government Employment as a Percentage of Total State/Provincial Employment
    Economic freedom decreases for several reasons as government employment
    increases beyond what is necessary for government’s productive and protective func-
    tions. Government, in effect, is using expropriated money to take an amount of labor
    out of the labor market. This restricts the ability of individuals and organizations to
    contract freely for labor services since employers looking to hire have to bid against
    their own tax dollars to obtain labor. High levels of government employment may also
    indicate that government is attempting to supply goods and services that individuals
    contracting freely with each other could provide on their own; that the government is

    attempting to provide goods and services that individuals would not care to obtain if
    able to contract freely; or that government is engaging in regulatory and other activi-
    ties that restrict the freedom of citizens. Finally, high levels of government employ-
    ment suggest government is directly undertaking work that could be contracted pri-
    vately. When government, instead of funding private providers, decides to provide a
    good or service directly, it reduces economic freedom by limiting choice and by typi-
    cally creating a governmental quasi-monopoly in provision of services. For instance,
    the creation of school vouchers may not decrease government expenditures but it will
    reduce government employment, eroding government’s monopoly on the provision
    of publicly funded education services while creating more choice for parents and
    students and, thus, enhancing economic freedom.
    3Aiii Union Density
    Workers should have the right to form and join unions, or not to do so, as they choose.
    However, laws and regulations governing the labor market often force workers to join
    unions when they would rather not, permit unionization drives where coercion can
    be employed (particularly when there are undemocratic provisions such as union
    certification without a vote by secret ballot), and may make decertification difficult
    even when a majority of workers would favor it. On the other hand, with rare excep-
    tions, a majority of workers can always unionize a workplace and workers are free to
    join an existing or newly formed union.
    To this point in time, there is no reliable compilation of historical data about
    labor-market laws and regulations that would permit comparisons across jurisdictions
    for the United States, Canada, and Mexico. In this report, therefore, we attempt to pro-
    vide a proxy for this component. We begin with union density, that is, the percentage
    of unionized workers in a state or province. However, a number of factors affect union
    density: laws and regulations, the level of government employment, and manufacturing
    density. In measuring economic freedom, our goal is to capture the impact of policy
    factors, laws and regulations, and so on, not other factors. We also wish to exclude gov-
    ernment employment—although it is a policy factor that is highly correlated with levels
    of unionization—since government employment is captured in component 3Aii above.
    Thus, we ran statistical tests to determine how significant an effect government
    employment had on unionization—a highly significant effect—and held this factor
    constant in calculating the component. We also ran tests to determine if the size of
    the manufacturing sector was significant. It was not and, therefore, we did not cor-
    rect for this factor in calculating the component. It may also be that the size of the
    rural population has an impact on unionization. Unfortunately, consistent data from
    Canada, the United States, and Mexico are not available. Despite this limitation, the
    authors believe this proxy component is the best available at this time. Its results are
    consistent with the published information that is available (see, for example, Godin,
    Palacios, Clemens, Veldhius, and Karabegović, 2006).9

    Most of the components of the three areas described above exist for both the
    subnational and the all-government levels. Total tax revenue from own sources, for
    example, is calculated first for local/municipal and provincial/state governments, and
    then again counting all levels of government that capture revenue from individuals
    living in a given province or state.
    Components added for the all-government index
    To reflect the recent divergence in economic freedom between Canada and the United
    States more closely, and to incorporate more accurately the differences in economic
    freedom in the Mexican states relative to the rest of North America, we include a num-
    ber of variables from the world index in our all-government index of North American
    states and provinces. The index expands the regulatory area to include data on these
    areas. Labour regulation becomes one of three components of Area 3: Regulation,
    which comprises 3A: Labour market regulation; 3B: Credit market regulation (Area
    5A from Economic Freedom of the World); and 3C: Business regulations (Area 5C from
    EFW). (See Appendix A for a description of how Area*3 is now calculated.)
    Why the regulation of credit and business affects economic freedom is eas-
    ily understood. When government limits who can lend to and borrow from whom
    and puts other restrictions on credit markets, economic freedom is reduced; when
    government limits business people’s ability to make their own decisions, freedom
    is reduced.
    3A Labor Market Regulation
    3Aiv Hiring regulations and minimum wage
    3Av Hiring and firing regulations
    3Avi Centralized collective bargaining
    3Avii Hours regulations
    3Aviii Mandated cost of worker dismissal
    3Aix Conscription
    3B Credit Market Regulation
    3Bi Ownership of banks
    3Bii Private sector credit
    3Biii Interest rate controls/negative real interest rates

    3C Business Regulations
    3Ci Administrative requirements
    3Cii Bureaucracy costs
    3Ciii Starting a business
    3Civ Extra payments/bribes/favoritism
    3Cv Licensing restrictions
    3Cvi Cost of tax compliance
    We also include three other areas: Area 4: Legal System and Property Rights (Area
    2 from Economic Freedom of the World), Area 5: Sound Money (Area 3 from EFW),
    and Area 6: Freedom to Trade Internationally (Area 4 from EFW). See Gwartney,
    Lawson, and Hall, 2016, for a complete description of these variables.
    Area 4 Legal System and Property Rights
    Protection of property rights and a sound legal system are vital for economic freedom,
    otherwise the government and other powerful economic actors for their own benefit
    can limit the economic freedom of the less powerful. The variables for Legal System
    and Property Rights from the world index are the following.
    4A Judicial Independence
    4B Impartial Courts
    4C Protection of Property Rights
    4D Military Interference in Rule of Law and Politics
    4E Integrity of the Legal System
    4F Legal Enforcement of Contracts
    4G Regulatory Restrictions on the Sale of Real Property
    4H Reliability of Police
    4I Business Costs of Crime
    Area 5 Sound Money
    Provision of sound money is important for economic freedom because without it the
    resulting high rate of inflation serves as a hidden tax on consumers. The variables for
    Sound Money from the world index are the following.
    5A Money Growth
    5B Standard Deviation of Inflation
    5C Inflation: Most Recent Year
    5D Freedom to Own Foreign Currency Bank Accounts

    Area 6 Freedom to Trade Internationally
    Freedom to trade internationally is crucial to economic freedom because it increases
    the ability of individuals to engage in voluntary exchange, which creates wealth for
    both buyer and seller. The variables for Area 6 from the world index are the following.
    6A Tariffs
    6Ai Revenue from trade taxes (% of trade sector)
    6Aii Mean tariff rate
    6Aiii Standard deviation of tariff rates
    6B Regulatory trade barriers
    6Bi Non-tariff trade barriers
    6Bii Compliance costs of importing and exporting
    6C Black-market exchange rates
    6D Controls of the movement of capital and people
    6Di Foreign ownership/investment restrictions
    6Dii Capital controls
    6Diii Freedom of foreigners to visit
    More information on the variables and the calculations can be found in Appendices A
    and B. (For detailed descriptions of the world-adjusted variables, readers can refer to
    Economic Freedom of the World: 2017 Annual Report (https://www.fraserinstitute.org/studies/
    economic-freedom-of-the-world-2017-annual-report). The inclusion of these data from the
    world index raise the scores for both the Canadian provinces and US states since both
    Canada and the United States do well in these areas when compared to other nations,
    as is done in the world index. The effect on the Mexican states tends to be the opposite.
    Lifetime member of more than 1 national gun organization and the New Hampshire Liberty Alliance. Part of Young Americans for Liberty and Campaign for Liberty. Free State Project participant and multi-year Free Talk Live AMPlifier.


Similar Threads

  1. TIME Announces 2017 Person of the Year
    By timosman in forum U.S. Political News
    Replies: 2
    Last Post: 12-05-2017, 02:04 AM
  2. North Carolina Overcriminalization: Update 2017
    By phill4paul in forum North Carolina
    Replies: 3
    Last Post: 08-03-2017, 04:34 PM
  3. 2017 - Ron Paul's New Year Predictions
    By jct74 in forum Ron Paul Forum
    Replies: 1
    Last Post: 01-01-2017, 08:04 PM
  4. 2017 could prove to be gold's 'magic' year
    By Brian4Liberty in forum Economy & Markets
    Replies: 7
    Last Post: 07-23-2015, 01:47 PM
  5. The Clock Is Ticking On America's Last Year Of Freedom
    By Kregener in forum U.S. Political News
    Replies: 3
    Last Post: 12-30-2007, 01:09 PM

Select a tag for more discussion on that topic

Posting Permissions

  • You may not post new threads
  • You may not post replies
  • You may not post attachments
  • You may not edit your posts
  •