One day, in a newspaper, he came across a list of financial panics that occurred between 1683 and 1907. On a lark, he divided the span (two hundred and twenty-four years) by the number of panics (twenty-six) and found that, on average, there had been a panic every 8.6 years. As he read more, he began to suspect that 8.6 was a highly significant number. He discerned a recurrence of major turning points in the economy and in world affairs that followed a distinct and unwavering 8.6-year rhythm. Six cycles of 8.6 years added up to a long-wave cycle of 51.6 years, which separated such phenomena as Black Friday and the commodity panic of 1920, and the Second and Third Punic Wars.
[...]
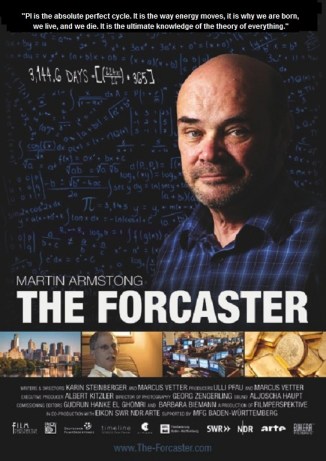
He opened a forecasting firm called Princeton Economics International, based in Princeton, New Jersey. His model singled out, in advance, the day of the October, 1987, crash. “Never did I expect this to work on such a precise time level,” he wrote later, in an essay called “Understanding the Real Economy.” “It made no sense. I personally assumed it was just a fluke. This took place on the minor halfway point up the first leg of the 8.6-year cycle, at 2.15 years.” Afterward, he was messing around with numbers and realized that 8.6 years was exactly three thousand one hundred and forty-one days: 3,141, the number pi times a thousand. The cycle mystery had deepened. If pi was essential to the physical world, perhaps it somehow governed the markets, or the fluctuations in human behavior and mood that manifested themselves in the markets. It was, after all, the magic number associated with the swing of a pendulum, Heisenberg’s uncertainty principle, and the Great Pyramid at Giza. Why not the vast monuments of data known as the financial markets? “Suddenly I saw it in my mind’s eye,” he wrote. “There was a Geometry of Time itself.”
[...] “Given a certain set of circumstances, people do the same thing over and over again,” he said. “There aren’t many options.”


 Reply With Quote


 I don't have "bad" opinion of Armstrong. I don't know very much about him - but from what little I do know, he seems like a really sharp guy. That "Delphic oracles" thing just had to do with one particular and very specific claim he made - namely, that computers can forecast socio-political trends without human bias.
 - but that was only offered as an assessment of the claim, not of Armstrong himself.

")


Connect With Us